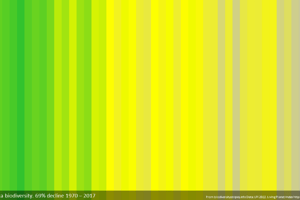
‘Biodiversity stripes’ provide a visual representation of the change in biodiversity over time, often to show the levels of decline since 1970. The highest level of biodiversity is coloured bright green. Lower levels of decline are shown through yellow to grey colours, and greater declines are shown by darker greys.
The ‘stripes’ method was first developed for climate warming, and the stripes were created at the University of Reading by Professor Ed Hawkins in 2018. Then in 2022 Professor Miles Richardson from the University of Derby, created the biodiversity stripes and set up a page dedicated to the topic. Biodiversity loss gets eight times less coverage than Climate change, which is why Professor Richardson is using the stripes to gain more coverage and awareness of the issue. In order to pass on a stable planet to future generations, it’s vital that we address both the warming climate and loss of biodiversity.
The original stripes used data from the Living Planet Index. This data tells us that since 1970 the population of birds, mammals, fish, amphibians and reptiles has seen an average drop of 69% globally. The global data includes over 30,000 populations of over 5,000 species. The UK stripes use JNCC UK biodiversity indicators.
Why does biodiversity matter?
Biodiversity is the variety of life on Earth. It supports life and is essential in providing the food we eat and the air we breathe. Humans evolved within a natural, vibrant and biodiverse world. Biodiversity is vital for human wellbeing and consequently should be treated with care and respect. Yet through our use and control of nature, we have done great damage to the natural world, creating a spiralling breakdown - when biodiversity decreases so does our relationship with nature. We have therefore created a disconnected and ultimately failing relationship that the UN recognises as the main cause of the environmental crises.
Why stripes?
The different coloured stripes are simple and grab your attention whilst also raising awareness of biodiversity loss. Essentially, they are a simple way of showing the loss of wildlife in the hope of starting difficult but necessary conversations.
Measuring and indicating biodiversity is a complicated task, which can make the telling of a simple story a bit difficult, but there’s an urgent need to make the problem more visible. People can’t change their behaviour and habits if they have no knowledge or awareness of the issue.
How are the stripes created?
A figure is provided by the various data sets for each year. The highest is coloured green, the lowest grey, transitioning through yellow. The amount of grey is linked to the level of decline. The position of the yellow is also dependent on the level of decline, so the greater the decline the sooner the stripe will reach yellow. Some datasets are quite smooth, and the colour changes are too subtle for stripes to emerge.
The biodiversity stripes weren’t created with design expertise and user testing or by a funded project. However, the Coblis colour blindness simulator has been used to check how the stripes come through for those with difficulty seeing colour. This is something still being researched.
Where have the stripes been used?
The global Nature Positive campaign led by Nature4Climate, Nature Positive at COP27, is using the stripes where they appeared at COP27 and COP15.
Scientist Philippe Grandcolas from the French National Centre used the stripes to open an official seminar for Scientific Research (CNRS) on biodiversity loss and climate change with French MPs in the French National Assembly.